This report was first published by Winchester Action on the Climate Crisis (WinACC)
******
written by Bill Gunyon for the WinACC Renewable Energy Action Group
February 2022
The report should be of interest to all those encouraging and implementing renewable energy plans in Winchester District, action that is crucial to decarbonisation of the electricity grid and the achievement of a net-zero Winchester District.
For analysis of progress on reducing emissions, as opposed to increasing renewable energy, please refer to the 11th edition of Greenhouse Gas Emissions in Winchester District, published by WinACC in October 2021.
end of page 1
Contents
Questions for feedback and discussion
B. Ambition for renewable energy in the District
B.2 Local implications of the 6th Carbon Budget
B.3 District renewable energy plan
B.4 Target for renewable energy in Winchester District
C.1 Priority for solar farms or rooftop?
C.2 Solar farm planning applications
C.4 Responding to solar farms in a climate emergency
Energy terminology and metrics
Appendix 1: 2020 baseline data
Appendix 2: Solar pv in the 6th Carbon Budget
Appendix 3: Managing intermittency of UK renewables
Appendix 4: Alternative indicators for monitoring local energy
Appendix 5: Energy opportunity mapping: Test Valley case study
Appendix 6: Increase in wind and solar to deliver Targets
Appendix 7: Local solar platforms: solar farms or rooftop?
Appendix 8: Solar farm pipeline in Winchester District
Acronyms and Terminology
“renewable energy” is expressed in this report only in the context of generating electricity. References to energy (eg.energy plans, energy projects etc) relate to renewable energy. As solar and wind dominate UK renewable energy plans for the coming decade, other clean technologies are not addressed in this report.
“net-zero” – the point at which greenhouse gas emissions are in balance with the capacity to remove them from the atmosphere, through natural sinks (eg trees) and through capture and storage technologies
“non-domestic” – describes all buildings that are not domestic private homes
“solar farm” – large ground-based installation of solar panels, also known as “solar park” or “utility-scale solar”
6CB – 6th Carbon Budget
REAG – WinACC Renewable Energy Action Group
WinACC – Winchester Action on the Climate Crisis
end of page 2
Introduction
Recent events highlight that the UK is not immune to global challenges including volatile energy supply and climate change. We face long term structural change to our economy and society. In the era since World War II, much of the world has enjoyed unparalleled and accelerating economic growth based on fossil fuels; to maintain growth while transitioning away from coal, oil and gas requires compromises for us in the UK.
This challenge is succinctly described in the UK’s 6th carbon budget (6CB), recently approved in Parliament. The 6CB sets out dramatic emission reduction and carbon removal targets to achieve net zero by 2050 – only 28 years away – including a sixfold increase in solar power.
This report explains how Winchester District could and should respond locally to the challenge set by the 6CB, an appropriate scale of ambition for renewable energy within the District and a possible target for solar energy.
The report begins by setting out the current contribution of renewable energy in the District. It then analyses alternative responses to the challenge of 6CB, with a view to determining ambition by 2030, Winchester City Council’s target date for local carbon neutrality. The report recognises the complex challenge of decarbonisation, and presents options for discussion between interested parties, rather than specific recommendations.
The final section of the report tackles the challenging consequences of 6CB, including the availability of rural land to allow for major and rapid expansion of solar farms (not forgetting potential for onshore wind) in the District, given that rooftop solutions will, even at their maximum deployment, only contribute a minor proportion of the requirement. Our experience of reviewing solar farm applications, interpreting their strengths and weaknesses for our local community, may be of interest beyond our District.
Noting current resistance to solar farms amongst parts of our society, the report suggests reappraisal of the meaning of “climate emergency” – questioning how we might each respond to the challenges we face and therefore our attitudes to solar farms in our District.
Publication of this report coincides with unusually volatile economic and policy conditions relating to our subject. Where analysis here is overtaken by events, our website content will strive to be responsive. We welcome your feedback on the report, in particular we are keen to receive:
- constructive criticism, with any aspects we have omitted or misrepresented
- suggestions for improvement of the content or suggestions on advocacy
- offers of support, proposed changes or critical feedback from officers and councillors of City, County and Parish Councils, helping us to improve our advice and assistance.
Your advocacy, views and actions are the only way in which the ambitions of 6CB can be achieved. WinACC’s charitable objectives are to work to support you in that endeavour.
David Jones, Chair, WinACC Renewable Energy Action Group
end of page 3
Summary of Findings
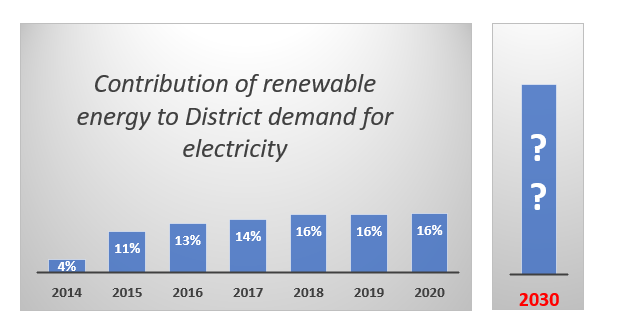
In 2020 renewable energy installations in Winchester District met only 16% of the District’s demand for electricity. Almost 100% of this renewable supply was generated by solar photovoltaics (solar pv) technology.
The UK 6th Carbon Budget, approved by Parliament in 2021, targets decarbonisation of the electricity grid as early as 2035. Demand for electricity along the path to net zero 2050 will double. The Budget requires onshore wind capacity to double and solar capacity to increase sixfold.
*****
The state of climate emergency that has been declared in the District is not generally taken into account in responses to solar farm planning applications, whether from the general public or from professional consultees.
The current planning pipeline of solar farms could almost double renewable generation in the District, if approved.
There are no sites suitable for a solar farm on the current brownfield register for Winchester District. The register lists small sites linked to housing plans.
The successful solar farm application in Headbourne Worthy parish was the first approved in the District in 4 years. It will generate almost double the output of the entire local portfolio of rooftop solar installed in the last 15 years.
Private capital is available to fund new solar farms, representing a massive injection of climate finance to achieve the District’s vision of carbon neutrality.
There are no known projects in the District, either installed or pipeline, that could be described as “community energy”.
Neither the City Council nor WinACC is currently in a position to employ staff with expertise relevant to renewable energy.
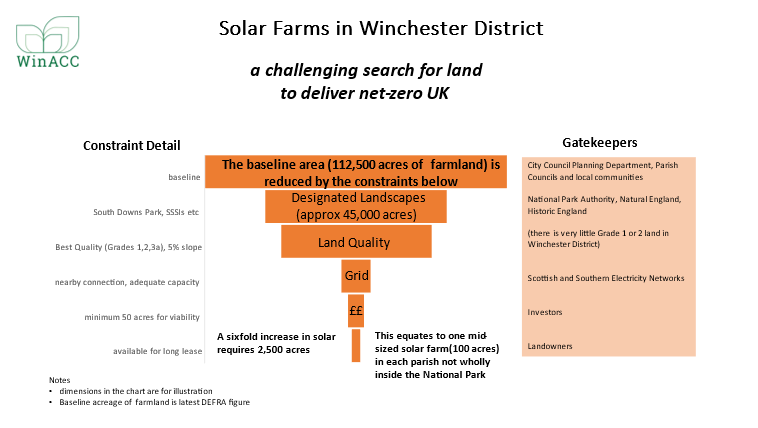
| Implications of the 6th Carbon Budget for Winchester District The renewable energy target in the City Council’s Carbon Neutrality Action Plan should be reviewed. The scale of land required for a sixfold increase of local solar farm capacity will be about 2,500 acres. A sixfold increase in rooftop solar in Winchester District will be demanding, and almost certainly be dependent on subsidy. It will be necessary to activate the potential for wind energy that exists within the District. |
end of page 4
Questions for feedback and discussion
What target and deadline for renewable energy generation is appropriate for a carbon neutral Winchester District? (pp12-14)
How can a pool of resources across all renewable energy stakeholders be created to deliver a District area renewable energy plan, and how can funds be raised to coordinate them? (pp10-11)
How can more sites suitable for solar farms be found, ideally in response to the “call for green sites” instigated by the Local Plan Review? How can we finance an energy opportunity mapping survey for the District, similar to that commissioned by Test Valley Borough? (pp16-18 and Appendix 5)
How should the Local Plan review anticipate the land requirement on this scale? (pp10-11)
How can the very significant local communications challenge to promote the benefits of solar farms and address misunderstandings be met? (p16)
What changes might encourage all parties involved with a solar farm application to respond in a manner appropriate to a climate emergency? (pp20-21)
How can every parish become involved in the national electricity decarbonisation agenda? (pp18-19)
How can discussion about these questions be as inclusive as possible?
end of page 5
A. Progress to date
A.1 Where we are now
Winchester District hosts over 2,500 installations of renewable energy, ranging from the solar farm on 200 acres of the Southwick Estate to micro-projects deploying a single solar panel. Government data enables a comparison between the total supply of this renewable energy with the overall demand for electricity from homes and organisations in the District:
| Contribution of renewable energy to District demand in 2020 Solar farms 13.6% Domestic solar 1.4% Non-domestic solar 0.8% Other renewable technologies 0.3% Total 16.1% see Appendix 1 for detail and sources |
These data sources also enable the trend in this indicator to be traced back to 2014:
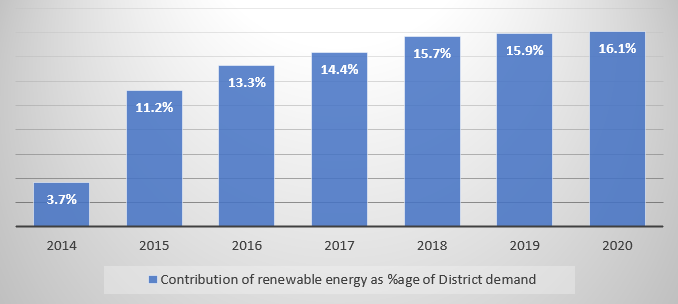
The contribution of renewable energy trebled in 2015 when the Southwick solar farm became operational. That source still contributes almost half of the local renewable output.
A new solar farm site in Headbourne Worthy parish received planning permission in 2021. When it becomes operational, the contribution of renewable energy will rise to about 20%.
Growth in the contribution of renewable energy has been disappointingly flat in recent years as the feed-in tariff subsidy was reduced, and then withdrawn in 2019. Demand for electricity in the District since 2014 has fallen only by 8%.
It is clear that this modest local contribution of renewable energy to local demand must rise very significantly and urgently if a net-zero vision in our District by 2030 is to be credible.
end of page 6
B. Ambition for renewable energy in the District
B.1 National Context
The 6th Carbon Budget (6CB) published by the Climate Change Committee in December 2020 is a product of the widely admired UK Climate Change Act. It presents a very detailed roadmap to achieve the government’s 2050 net-zero objective.
In the context of decarbonising the national electricity grid, 6CB predicts future demand for electricity to 2050 and the profile of generation technologies necessary to deliver the supply.
Recognising the long-term uncertainties amongst so many assumptions, these projections encompass four separate scenarios. The “Balanced Pathway”, on which this report is based, “keeps open the option to 2035 of achieving any of these (four scenarios) by 2050.”
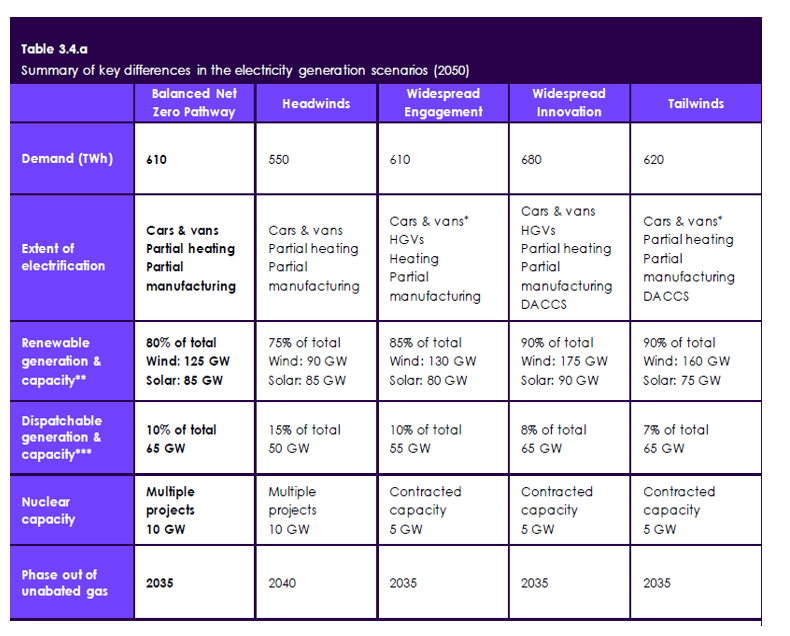
| Relevant extracts from 6CB text | Charts for the Electricity Generation sector, from 6CB |
| Electricity demand doubles to 2050, reflecting electrification of sectors across the economy…..that excludes the production of hydrogen using surplus generation (Path to Net-Zero pp134-136). The Balanced Net Zero Pathway very largely decarbonises electricity generation by 2030, and decarbonises it completely by 2035 (Electricity Generation Summary p36) | 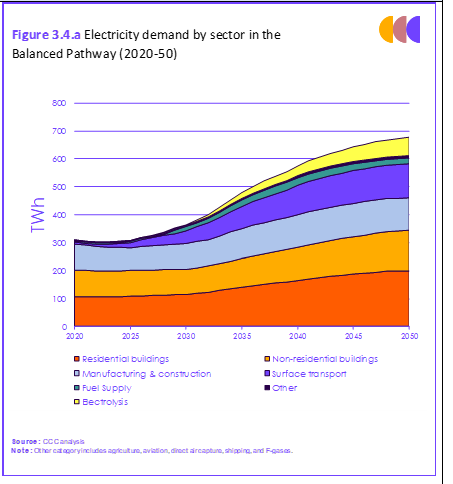 |
| end of page 7 | |
| Variable renewables reach 60% of generation by 2030, 70% by 2035, and 80% by 2050….Wind, particularly offshore, is the backbone of the system (Path to Net- Zero p134) All scenarios see new onshore wind generation being deployed by 2050…. almost doubling onshore wind capacity (Electricity Generation Summary p28) Large-scale solar currently …… requires 290 sq km (of land). Maximising the potential of solar generation might entail using an additional 1,500 sq km (Electricity Generation Summary p14) | 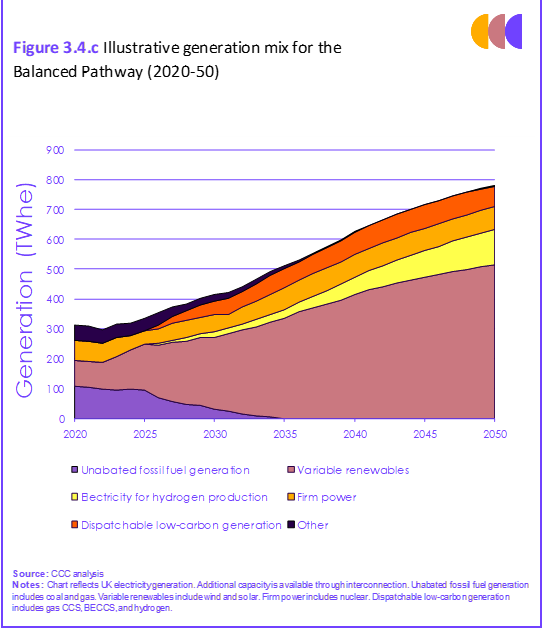 |
To reiterate that final phrase – the UK land requirement for “large scale solar” is projected to increase sixfold, from 290 to 1,790 square kilometres, by 2050. The additional 1,500 square kilometres (375,000 acres) equates to more than double the area of Winchester District, or more than the area of Berkshire.
Appendix 2 reproduces a Table from 6CB which confirms the projected sixfold increase for solar in the Balanced Pathway. It also confirms that similar expectations for solar capacity exist in all scenarios.
Appendix 3 summarises 6CB plans for managing the intermittency of “variable renewables” (solar and wind) by firm power (nuclear), “dispatchable” technologies (all depending on carbon capture and storage capacity) and storage technologies (hydrogen, hydro and batteries).
B.2 Local implications of the 6th Carbon Budget
As shown above, 6CB offers detailed year-by-year projections of the breakdown of electricity generation scenarios to 2050. But there is no regional disaggregation. WinACC’s Renewable Energy Action Group (REAG) therefore identified those implications of 6CB that might inform plans for our own District, summarised in Box 1.
end of page 8
| Box 1: Implications of 6CB roadmap for local renewable energy Impressive decarbonisation of the electricity grid has been achieved by closing large coal-fired power stations. Local generation technologies must now take over, even at the scale of individual homes and places of work, as well as the land-based sector. Decarbonising the electricity grid by 2035, well ahead of net-zero 2050, significantly increases the pressure on new renewable capacity. Consistent with a strong message of COP26, the next decade must see concerted action on renewable energy at scale. In this first decade, the priority for action will focus on electricity from solar and wind. Other renewable technologies, such as anaerobic digestion, will be important but on a small scale. There is a big national shift in favour of solar against onshore wind, despite similar costs. In 2020 onshore wind contributed more than double the electricity from solar in the national grid. By 2050 solar output will be well ahead, despite the doubling of onshore wind. A sixfold increase in existing solar capacity is very significant, beyond the scope of suitable roof space, even if the necessary subsidies become available. Utility scale ground-based solar will deliver a major share of the capacity requirement, as in the past. Solar power generation is a decentralised technology. It cannot be deployed offshore, like wind, or at the extremities of the UK land mass, like nuclear. Capturing the sun’s energy requires roof space and rural land. The contribution of rural districts to the climate emergency will be fulfilled through this land component, with a natural bias towards the higher intensity of the sun in southern counties. |
The Carbon Budget Order 2021 came into force in law last June, approved by both Houses of Parliament. The roadmap to net-zero 2050 for all sectors of the economy laid out in 6CB is now the legally binding basis for government policy and for annual progress reporting to Parliament. For electricity generation, approval of 6CB informs the following:
- the current review of National Policy Statements for energy infrastructure, now pending revision for Parliamentary scrutiny
- the National Grid’s ESO Future Energy Scenarios, published annually, providing a view of how changes will impact the Electricity Transmission System
- Distribution Network future energy scenarios, such as that for SSEN, who have instigated consultation in our region, through the consultancy Regen. As Distribution Network Operator SSEN is responsible for investment to meet local demands of increased renewable generation, electric vehicle charging and heat decarbonisation.
A process that links energy supply and demand in Winchester District with the contents of the 6th Carbon Budget is occurring through these agencies, directed by legislation. At this point, REAG strengthened aspects of its interpretation, as in Box 2.
end of page 9
| Box 2: Implications of Parliamentary approval of 6CB for local planning There is no choice but to plan for a transformation in the scale of both rooftop and ground-based solar technology in all areas, including Winchester District. The Local Plan review under way for Winchester District has an obligation to consider the scale of land use requirements for electricity generation. UK carbon budgets are updated on a five-yearly cycle, the next not due until 2026. For now, infrastructure planning must proceed in line with the balance of generation technologies proposed in 6CB. This draws attention to the contradictions between the 6CB requirement for doubling onshore wind and the restrictive planning measure introduced by Parliament in 2015. It is evident that the Climate Change Committee will need to intervene. Already, its June 2021 Report to Parliament contains a hint: “Priority Recommendation for 2022: Address potential barriers to deploying and using low-carbon generation at scale (e.g. the planning and consenting regime for renewables and networks).” We therefore anticipate onshore wind to feature in future energy plans for our District. |
B.3 District renewable energy plan
A local action plan for renewable energy has an advantage over other key sectors for net-zero ambition. Parallel plans for buildings and transport depend critically on the adequacy of central government subsidy and policy. Whilst subsidy is likely to be essential for the market for domestic rooftop solar, a local energy plan for solar farms has less need for references to the local authority’s “limited scope of influence.”
The Local Authorities report commissioned for 6CB makes the same observation: “local planning authorities have powers to support and determine renewable energy generation in their areas.” This relative freedom may be a pointer for priority allocation of resources for the climate emergency in the short term.
| Box 4: Scale is the challenge for a District renewable energy plan The implications for Winchester District of the sixfold increase in existing solar capacity envisaged in 6CB: **approximately 11,000 further homes and businesses will need to install rooftop panels **2,500 acres of land will be necessary for the expansion of solar farms. This equates to an average of one mid-sized solar farm of 100 acres in each parish that is not wholly inside the South Downs National Park. |
end of page 10
Winchester City Council’s Carbon Neutrality Action Plan was published in early 2020, in advance of the 6CB. It refers to Council support for renewable energy, including large scale solar, but with no detail of how to progress towards decarbonisation. To achieve net zero, the Plan’s target for increasing renewable energy is measured by a corresponding reduction of carbon dioxide emissions, a method which is questioned in Appendix 4.
Given the clarity of analysis of supply and demand for electricity in 6CB, and the legally binding status of the Carbon Budget, this is an appropriate moment for Winchester City Council to review its energy target (see B.4 below) and publish an implementation plan.
Planning and implementation of renewable energy strategy is complex, both in understanding the technology and in the range of professional expertise involved. Coordination skills with experience of the energy sector are very desirable. Yet the finances of local authorities have been squeezed into a position where specialist staff resources are unaffordable. Our own City Council is no exception.
Box 3 records REAG’s view on this dilemma. Having no commercial interest in energy projects, WinACC may be well positioned to facilitate productive relationships with stakeholders such as Greater Southeast Energy Hub, SSEN, Enterprise M3 (LEP), as well as the implementing parties – local businesses, landowners and the private sector energy companies. We are also familiar with the renewable energy initiatives of Hampshire County Council and the South Downs National Park Authority.
| Box 3: A framework for District action on renewable energy In 2014, WinACC’s Renewable Energy Action Group published Winchester District Renewables Strategy, presenting the challenge of decarbonisation as an opportunity for local economic development and job creation. It suggested the formation of: A partnership ……. to take forward work on renewable energy in the District, through the development and implementation of a strategy and action plan. The members of this partnership will be responsible for mobilising and committing the resources necessary to implement the plan from within each of their own organisations. REAG adheres to this longstanding analysis and will support an approach that pulls together the expertise and resources of a wide range of stakeholders. The 6CB encourages Local Authorities to “work with distribution network operators, neighbouring authorities and across their wider climate and energy partnerships to prepare local energy plans for the area.” |
A new Local Plan for Winchester District is due to come into effect in 2024 for the period 2019-2039. The new Plan will be of vital importance in the longer term as a strategic enabler for renewable energy plans.
REAG appreciates the willingness of the City Council’s Local Plan review team to share discussions about their approach to renewable energy.
end of page 11
B.4 Target for renewable energy in Winchester District
REAG believes that Winchester District should build capacity in renewable energy which represents its fair contribution to national decarbonisation of the electricity grid.
A “fair contribution” as the target for district-based renewable energy might be framed by the following characteristics:
| Indicator | A target contribution of renewable energy could be expressed and monitored as a percentage of the demand for electricity in the District, as illustrated in the presentation of 2020 data in A.1. This is relatively easy to understand, to measure and to compare with other districts. It can be disaggregated to smaller units such as a parish. And it imposes a constant reminder of the importance of actions to reduce local demand for electricity, such as use of public transport, smart household appliances and low carbon heating. |
| Fairness | A target might recognise, and indeed celebrate, that it contributes to a shared national endeavour in a climate emergency, compelling a subjective element of fairness. The 2020 percentage contribution of renewable energy in each district could be a sound starting point for assessing a “fair contribution” to net-zero. It has accrued over the last 10-15 years on a level playing field of market conditions, subsidy and planning regulations for renewable energy. Any significant local constraints or opportunities should already be reflected in that baseline figure. For example, Winchester’s renewable energy contribution of 16.1% has been constrained by planning limitations on solar farms in the South Downs National Park. Approximately 40% of the District is inside the Park. Applying the 6CB Balanced Scenario increases for wind (2x) and solar (6x) to this baseline in every district would secure the necessary aggregate contribution to decarbonisation, by a means that is arguably fair. In Winchester District this formula would create a target of just under 50% of demand in 2050. However, sustaining the current zero contribution of wind energy may not fulfil the “fairness” test. |
| Timetable | The deadline for reaching a target should accelerate the 6CB timetable, consistent with the existing goal of a carbon neutral Winchester District by 2030, rather than 2050. Furthermore, the means of acceleration should be within the influence of the District, recognising that central government interventions will focus on its preferred 2050 goal. |
Technology can also play a role in consideration of a local target for renewable energy by mapping energy opportunities across the area. Software tools exist to assess the potential of land for onshore wind and ground-based solar, taking account of constraints such as the quality of agricultural land and designated landscapes.
end of page 12
Evidence suggests that this energy opportunity mapping approach yields very high figures, far exceeding local demand for electricity. A technical survey commissioned by Test Valley Borough Council (neighbouring Winchester District) found that ground-based solar alone has the potential to deliver more than 20 times the current demand for electricity in the Borough. 6CB also notes that total UK potential for onshore wind is over three times the figure in its recommended mix for 2050, and over seven times the figure proposed for solar.
Technology is unable to quantify the subjective element of landscape sensitivity that affects public resistance to a large energy project. Nonetheless, a technical assessment in Winchester District would create an objective starting point, both for the District as a whole and for smaller scale potential across individual parishes.
The Test Valley survey features as a case study in The Climate Crisis: A Guide for Local Authorities on Planning for Climate Change published in October 2021 by Town and Country Planning Association and Royal Town Planning Institute. Their verdict is: “the study provides a robust evidence base to underpin planning policies relating to renewable and low-carbon energy generation and low-carbon development within the local plan.”
Appendix 5 illustrates energy opportunity mapping by reference to this evidence produced for Test Valley Borough.
Options for a Renewable Energy Target for Winchester District
This report proposes three alternative target formulae for consideration, reflecting the analysis above, combining fairness with ambition appropriate to Winchester District:
| Nature of Target | 2030* Target Formula as percentage of local demand** | Rationale |
| Low Ambition | 50% | The basic “fair contribution” approach outlined above |
| Enhanced Ambition (adding wind) | 50%-100% (depending on wind target) | Recognises that a baseline of zero wind technology is an untenable reflection of the potential that exists in Winchester District. |
| Full Potential | 100% | Matches local supply with local demand and cuts through subjective debate about “fairness”. It brings additional benefits such as maximising local pressure to reduce demand. It would also convey to new housing developers and employers that incremental energy demand should be matched by onsite generation, or new local supply. |
| * consistent with the declared goal of a carbon neutral Winchester District by 2030 **local demand is assumed to increase in line with the 6CB national projection ie 20% by 2030, 50% by 2035 and 100% by 2050. Renewable capacity will therefore continue to increase after 2030. | ||
| Appendix 6 presents a fuller version of this table, illustrating the increase in solar and wind installations that would be necessary to deliver these targets. | ||
end of page 13
This visual presentation aims to clarify these three alternatives for Winchester District:
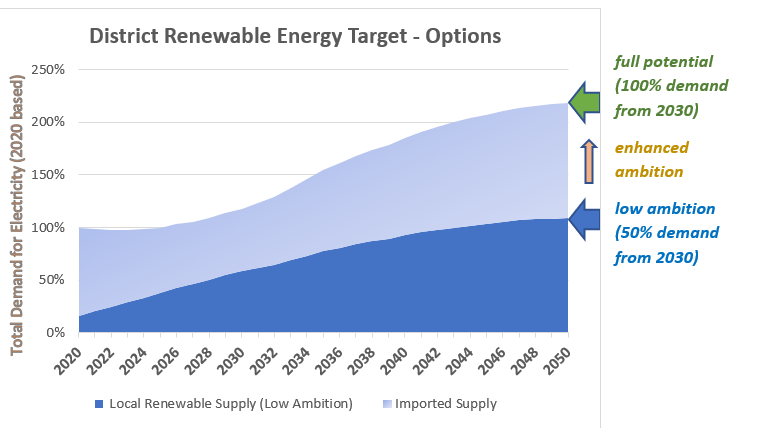
The choice of target will reflect local attitudes towards dependence on imported energy, as well as fairness. In the low ambition target illustrated in the chart, the District would depend on importing as much energy (light blue) as it generates (dark blue). To remove this dependence completely, the target should be enhanced to the full potential (eliminating the light blue area).
There are imperfections in each of these target options – and any concept of self-sufficiency in local energy supply is much more complex than implied.
However, local energy capacity may be heading towards a collective apportionment exercise. Arguing for a modest target in one district, perhaps citing the quality of its landscape and heritage assets, requires other districts to accept qualitative inferiority and willingness to make good the difference. This is an unreasonable premise that invokes the spectre of central government quotas for renewable energy contributions, likely to be as unpopular as housing quotas.
end of page 14
C. Advocacy for solar farms
This section explains how the work of the Renewable Energy Action Group through 2021 focused on support for planning applications for solar farms. It will share the ideas emerging in the search for more positive attitudes towards solar farms amongst all concerned. This is an unusual activity for a climate action charity and may be of interest beyond our District.
C.1 Priority for solar farms or rooftop?
Dependent largely on volunteer resources, WinACC action groups prioritise activities which can make a real contribution to the District’s net-zero vision. At the beginning of 2021, the important local implications of the 6th Carbon Budget became apparent, as noted in this report.
REAG first agreed to set aside action on local wind potential until the government is persuaded to amend its restrictive planning policy. Successful planning applications for new onshore wind sites in England have reduced to a trickle in recent years.
Challenged by the urgency of expanding solar installations, the prioritisation question was straightforward. Which of the three familiar platforms for solar offered the most potential?
| Solar platform | Priority considerations in early 2021 |
| Domestic rooftop | A small number of homeowners continued to invest in rooftop solar, despite the loss of the feed-in tariff scheme in 2019. However, the financial equation presented by the replacement Smart Export Guarantee scheme is insufficiently persuasive for the vast majority. The Green Homes grant scheme on offer in early 2021 excluded solar. |
| Non-domestic rooftop | Larger scale rooftop schemes can present a more persuasive financial model. However, employers in all sectors were fundamentally disrupted by the pandemic. |
| Solar farm | A pipeline of local planning applications for utility-scale solar farms had re-emerged in the middle of 2020, having lapsed completely for over four years. Data published by Solar Energy UK (representing the solar industry) confirmed a revival of capital investment available for this model. Falling costs of solar technology were such that suitable sites from approximately 50-250 acres had become economically viable, without dependence on subsidy. |
The analysis clearly pointed to solar farms for priority action. Aside from the compelling mathematics of the impact of solar farms relative to rooftop solar, the mantra of “follow the money” is pertinent. Lack of climate finance is the major obstacle for tackling the climate crisis at all levels, from the Paris Agreement to local district declarations of net-zero goals.
At 2021 prices, a sixfold increase in solar farms in our District requires investment of the order of £250 million. No local entity in public or private sectors displays any relish for infrastructure capital funding on that scale. With international energy companies queuing up to pay the bills for local decarbonisation, the priority was straightforward.
end of page 15
Appendix 7 discusses the longer-term prospective weighting between solar farms and rooftop solar in the District, suggesting that the current balance is unlikely to change even with adequate government support for rooftop installations.
C.2 Solar farm planning applications
Supporting solar farm applications therefore became the primary activity of REAG. For each planning application, we seek engagement with the developer at an early stage, pointing out that WinACC support for the application will depend on:
- willingness to discuss potential problems, anticipated with the benefit of WinACC’s accrued local experience;
- engagement with the local community, in line with recognised best practice within the solar industry.
Website content is published for each planning application, aiming to draw attention to its salient features, saving time for those who might be overwhelmed by the jargon and volume of formal material. WinACC’s own response is published and, where appropriate, members are mobilised to add their voice in support.
Since mid-2020 when interest in solar farms revived, there have been six planning applications to Winchester City Council. The site at Christmas Hill in Headbourne Worthy was approved in May 2021, the first large scale solar development approved in Winchester District for four years.
Full details of this recent application history, set out in Appendix 8, demonstrate the slow-moving reality of the planning process for solar farms. To an extent this seems right and proper. For example, WinACC welcomes the willingness of developers and planners to work together on amendments to plans in response to issues raised, despite prolonging the timeframe. This approach has been pursued for both Godsfield Lane (Old Alresford) and Locks Farm (Bishop’s Waltham) applications. The approval of Christmas Hill was obtained only after plans were amended to satisfy Historic England that the setting of a Bronze Age ditch would not be permanently harmed.
REAG has noted the importance of scrupulous care in preparing the required evidence. If developers skate over important issues, they will be called to account, either by objectors, or by the planning professionals.
C.3 Lessons learned
In tackling the challenge of solar farms at such a level of detail, WinACC is playing an important role while conscious that we remain on the learning curve. For now, we share experiences that have been particularly striking.
Back to basics for communication
There is a widespread lack of knowledge about solar farms – their basic characteristics, their advantages and disadvantages. The local communications task is formidable.
end of page 16
A start has been made in creating content and writing articles for the WinACC website, and in creating visual presentations such as those in this report. Subject to pandemic restrictions, members of REAG are keen to meet local communities and their representatives, provide information and address their concerns. Solar Energy UK has responded positively to REAG’s encouragement to publish more educational content.
Scarcity of sites
It is never going to be straightforward to locate a site for a solar farm that fulfils the requirements of both the technology and the planning regulations. As if these obstacles were not enough, inadequacy of grid infrastructure often rules out a project, as explained in Solar Energy UK’s advocacy report Lighting the Way:
“the lack of available grid capacity and the growing need for reinforcement of both the transmission and distribution networks is perhaps the most significant medium to long-term barrier to solar deployment cited by our members”.
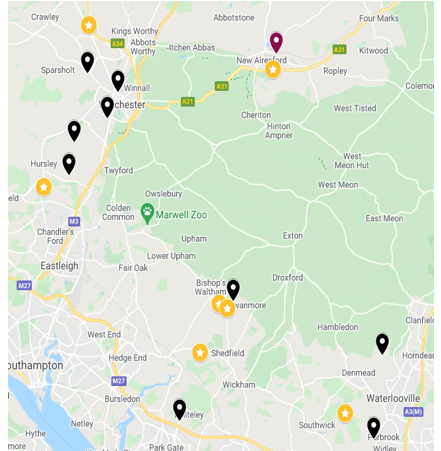
| Map of Winchester District illustrating the current dependence of solar farms (orange) on proximity to a primary grid substation (black). It is for this reason that solar farm sites are often crossed by overhead power lines which, to an extent, establishes a visual connection between energy and use of the land. The darker green shading is land inside the South Downs National Park. |
This accentuates the importance of the current pipeline of planning applications (Appendix 8). If these can all find their way to a successful conclusion, current capacity of solar in the District would almost double, creating a buffer for slow-moving grid investment and other post-Covid uncertainties for the solar industry.
WinACC has been calling on all parties involved in the planning process, both supporters and objectors, to view every solar farm planning application as a scarce commodity, deserving of every endeavour to resolve concerns.
end of page 17
Parishes can take back control
Of the six solar farm planning applications received over the last two years, only one of the parish or town councils involved has expressed its support. This reluctance to respond to the climate emergency underlines the communications challenge, mentioned above.
WinACC has been active in engaging parishes in the climate agenda through its WeCAN project. The project promotes climate activism within parish communities, encouraging net-zero action planning.
This approach can apply equally to a District renewable energy plan, encouraging a parish community to engage proactively with its own equation of energy supply and demand, anticipating new infrastructure for EV charging and home heating solutions.
Energy can play an integral role in the viability of the rural economy. The resilience of farming communities can be underpinned by the stable revenue of a long-term solar lease. Solar farm developers have an interest in the social and economic well-being of the local community and are open to negotiation.
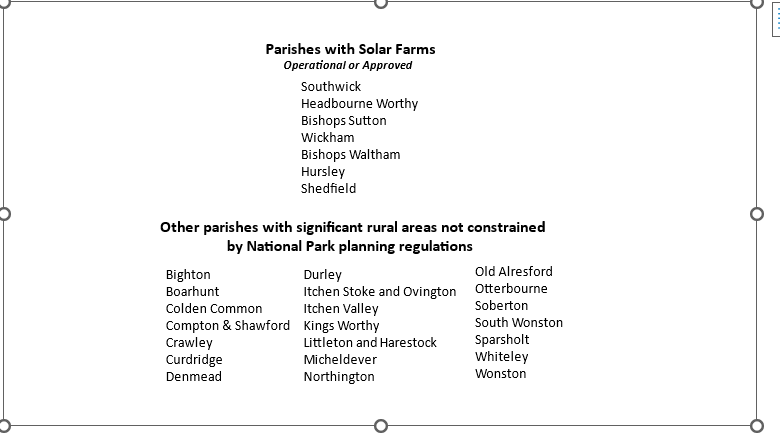
The new model of decentralised energy in a net-zero economy therefore creates an opportunity for parish communities to take back control. Responding to the challenge of locating at least one small solar farm in every parish that is not constrained by National Park regulations might prove stimulating, at very least.
end of page 18
The WeCAN project makes a difference in mobilising local climate action and supporting community climate action beyond the wards of the City of Winchester. Continuity of this project will benefit the agenda for renewable energy.
Understanding objections to solar farms
One planning application in particular (Godsfield Lane) provoked hundreds of public objections, creating a focused sample for analysis. They broadly fell into four categories:
- thoughtful concern for a familiar landscape, expressed by reference to specific planning policy or regulations
- “we support renewable energy but not here”
- genuine misunderstanding, often fuelled by single-issue organisations who are not taking an holistic view of the site or the demands of the 6th Carbon Budget. Examples of misunderstanding include the view that brownfield sites can absorb the burden of solar targets, when they manifestly cannot; or that solar farms destroy habitat and biodiversity, when the opposite is true.
- the unsubstantiated and untrue, such as exploding batteries, electrocuted livestock, and other statements that have no basis in fact.
Understanding objections, whether reasonable or not, will inform communications campaigns in support of solar farms. They are far from unique to Winchester District and WinACC can benefit from the efforts of professional advocacy within the solar trade.
The Godsfield Lane application also attracted over 150 expressions of support.
end of page 19
C.4 Responding to solar farms in a climate emergency
Having declared a climate emergency in 2019, the City Council’s newsletter, About Winchester, offered this reassurance in the Spring 2020 edition:
everything we do will be planned looking through the lens of the climate emergency.
The Covid-19 pandemic has delivered a reminder of what it means to live in a state of “emergency”. Everyone has been forced to question established norms, from the office commute to consuming entertainment.
However, anyone engaging closely with a solar farm planning application might be forgiven for wondering if the climate emergency is over. Consultee analysis and recommendations by national bodies, County and City Council specialist departments, rarely include any reference to climate change.
Paying attention to the climate emergency does not involve tearing up the planning regulations. In its 9-point policy advocacy paper for delivering decarbonisation, Solar Energy UK makes no significant demands of the planning regime.
The protection of landscape, heritage assets and individual households that is underwritten by the National Planning Policy Framework remains in place. Solar farm sites must be well-screened by natural contours and vegetation. Designated landscapes and the best quality agricultural land are unlikely to be approved.
A climate emergency leads to a very bad outcome if urgent measures are not taken. In the context of the UK rural economy, the bad outcomes threatened by climate change on its current trajectory to 2050 are familiar. In concise and simple terms, these are:
- a changing landscape due to warming, extreme weather, loss of native species and disruption to biodiversity
- exponentially rising costs of adapting to these changes
- an unstable future for generations to come.
This report is not the place to substantiate these predictions other than to point to the latest Independent Assessment of UK Climate Risk published by the Climate Change Committee in June 2021.
| Box 4: A digression into history Think back to the UK rural electrification programme in Hampshire between the World Wars. It was delayed for years by traditional country interests unable to countenance the visual intrusion of pylons on unspoiled green countryside. Young couples were desperate for the improvements in health and education of their children that power would deliver. Pylons have since increased in size and become a relatively tolerated feature of the landscape. |
end of page 20
Looking through the risk lens of the climate emergency might therefore add nuance to issues familiar to consideration of solar farm planning applications:
- the view from a public footpath, or the setting of an historic site, might be harmed more by climate change, more permanently, than by a solar farm
- the biodiversity gain, including soil regeneration, delivered by a solar farm supplements the recognised public benefit of renewable energy – and contributes to the goals of the City Council’s Biodiversity Action Plan
- concern for taking a solar farm site out of food production might be disproportionate in relation to the impact of climate change on crop yields of all land
- describing the presence of a solar farm as “visual intrusion” that upsets enjoyment of “unspoiled green countryside” is subjective. Many people suffer anxiety about environmental breakdown and feel positive in witnessing evidence of action
- The stability of revenue gained by farmers offsets the volatility of the land economy
A number of these perspectives are reinforced by the temporary status of solar farms that is stressed in all planning applications. The lifespan is typically 30-40 years, after which the infrastructure can be removed and the landscape restored.
An emergency can also be temporary, provided action is taken. Solar farms are a land use response to the climate emergency, capable of reversal.
The reflections in this section may not ultimately change the mind of an individual objector or the recommendation of a specialist adviser. However, any steps that could be taken to encourage consultee submissions to address and document issues relevant to the climate emergency might enhance the quality of decision-making by the local planning authority.
Conclusion
The expansion of solar farms is a vital component of “the path to net-zero” presented in the 6th Carbon Budget. Winchester District should play its part.
Much more should be done to communicate the benefits of solar farms, both at national level by the UK solar industry and locally – by local planning authorities and climate action groups.
Embedding the significance of an “emergency” into all responses to solar farm applications will do justice to the intergenerational threats posed by the impacts of climate change.
end of page 21
Technical Appendices
Energy terminology and metrics
| Energy Units | Energy Measures | Energy Benchmarks |
| One Kilowatt (kW) is 1,000 watts, the energy required to power an average domestic electric heating appliance | The Capacity of an energy installation is the energy generated when operating at maximum output eg. a small solar farm has capacity of 10MW | Mean domestic consumption per household in Winchester District in 2020 was 4,834 kWh. Source: BEIS |
| One Megawatt (MW) is 1,000 kilowatts | The Load Factor expresses the actual output of an installation in relation to its Capacity. The average load factor for UK solar farms in 2020 was 11.2%, and 28.1% for onshore wind. | Capacity of a typical domestic rooftop solar pv installation is 3.5kW which should generate 3,587kWh per annum* |
| One Gigawatt (GW) is 1,000 megawatts | Electricity Supply and Demand is calculated as the energy generated and consumed over a period eg 10 GWh per annum | Each megawatt (MW) of ground-based solar pv capacity requires up to five acres (two hectares) of land** |
| One Kilowatt hour (kWh) is the energy consumption of a 1kW appliance running for one hour – and likewise for MWh and GWh | A 10MW solar farm would deliver 1.75% of the 2019 demand for electricity in Winchester District* | |
| One 1.5MW wind turbine (hub height 65m) would deliver 0.7% of the 2019 demand for electricity in Winchester District* |
* based on 2020 load factor of 11.7% for solar pv and 31.1% for wind in the southeast region. Source: BEIS
** the 6th Carbon Budget used a benchmark of 2.2 hectares per MW but 2.0 is the figure widely used in the solar industry. There is some prospect of incremental improvement in performance in the near future, perhaps 10%-15%.
end of page 22
Appendix 1: 2020 baseline data
Table 1: Contribution of local renewable energy to District demand in 2020
| Number of Installations | Capacity (MW) | Annual output (GWh) | %age District demand* | |
| Solar pv | 2,534 | 94.485 | 92.925 | 15.8% |
| Wind | 2 | 0.036 | 0.098 | |
| Hydro | 4 | 0.039 | 0.143 | |
| Plant biomass | 1 | 0.350 | 1.747 | 0.3% |
| Totals | 2,541 | 94.909 | 94.913 | 16.1% |
Sources (BEIS): Regional Renewable Statistics (September 2021).
Local Authority Electricity Consumption Statistics (December 2021)
There are no known operational community energy installations in Winchester District.
Table 2: Breakdown of solar pv contribution
| Number of Sites | Capacity (MW) | Annual output (GWh) | %age District demand | |
| Solar farms (detailed in Table 3 below) | 6 | 81.2 | 79.8 | 13.6% |
| Domestic | 2,139 | 8.4 | 8.3 | 1.4% |
| Non-domestic | 93 | 4.9 | 4.8 | 0.8% |
| Totals | 2,238 | 94.5 | 92.9 | 15.8% |
Source: Sub-regional Feed-in Tariffs statistics indicate the number of domestic and non-domestic sites and their capacity registered with the FiT scheme at the time of its closure in March 2019. The shortfall in the total number of sites compared with Table 1 may be attributed to sites with more than one installation. According to Ofgem’s September 2021 report, the number of sites registered under the Smart Export Guarantee scheme (that replaced the FiT) is likely to be very few. This FiT source excludes solar farms, for which data is derived from Tables 1 and 3 in this Appendix.
Notes:
- rooftop installations will account for almost all domestic and non-domestic sites
- the load factor determining annual output for each category is assumed to be the same as that for all solar pv in the first table
end of page 23
Table 3: Operational solar farms in Winchester District
| Address | Parish/Town | Operator | Operational | Capacity (MW) |
| Raglington Farm, Botley Road, | Shedfield | NextEnergy Solar Fund | 2013 | 5.8 |
| Whitehill Lane, Alresford | Bishops Sutton | Lightsource Renewable Energy | 2014 | 12.0 |
| Southwick Estate, Belney Lane | Southwick | Bluefield Solar Income Fund | 2015 | 48.0 |
| Field House Farm, Hursley | Hursley | Foresight | 2015 | 6.4 |
| Winchester Road, Bishops Waltham | Bishops Waltham | Solafields | 2017 | 6.0* |
| Forest Farm, Winchester Road, Waltham Chase | Bishops Waltham | NESF | 2017 | 3.0 |
| Total | 81.2 | |||
Source: BEIS Renewable Energy Planning Database September 2021
For comparison with neighbouring rural districts, installed capacity of solar farms in Test Valley is more than double that of our District, whereas East Hampshire and Basingstoke and Deane are both about half.
end of page 24
Appendix 2: Solar pv in the 6th Carbon Budget
This chart from 6CB (p143) illustrates that the projected increase in solar pv capacity is significant in all scenarios.
At the end of 2020, 13.9 GW of solar pv capacity was installed in the UK, of which rooftop installations contributed 5GW.
The Balanced Pathway (85GW) therefore requires a sixfold increase in 2020 solar capacity.
The range of all scenarios (75GW – 90 GW) envisage the increase in solar capacity lying between 5x and 6.5x
end of page 25
Appendix 3: Managing intermittency of UK renewables
The 6th Carbon Budget acknowledges that the electricity system as a whole will incur costs to ensure security of supply as the share of variable renewables increases. These extracts from 6CB (pp135/136) explain the role of dispatchable low-carbon generation and storage technologies involved in the “integration” to manage intermittency.
Dispatchable low-carbon generation: Some flexible low-carbon generation (e.g. gas or bioenergy with carbon capture and storage (CCS), or hydrogen) will be required, in particular during periods of low production from variable weather-dependent renewables.
• Gas with CCS. From the second half of the 2020s, the Balanced Pathway sees the development of CCS infrastructure, which enables the deployment of gas CCS. By 2035, 30 TWh of generation comes from gas CCS, meeting 6% of demand.
• Bioenergy with carbon capture and storage (BECCS). Development of CCS infrastructure also enables deployment of BECCS plants. These could provide 3% of generation by 2035. Although they have higher costs than other ways of generating electricity, these plants provide an additional benefit of removing carbon from the atmosphere.
• Hydrogen can provide a flexible form of dispatchable generation similar to unabated gas. In the Balanced Pathway, some gas plants start to switch to hydrogen in the 2020s. By 2035, hydrogen gas plants provide 20 TWh of generation, meeting 5% of demand.
* Nuclear. Despite retirements of existing nuclear plants in the 2020s, this scenario sees new nuclear projects restore generation to current levels by 2035. The Balanced Pathway reaches 10 GW of total nuclear capacity by 2035, with 8 GW of new-build capacity.
Storage: With an increasing share of variable renewables, storage can capture surplus energy when demand is low and provide backup generation when demand is particularly high.
* The Balanced Pathway uses hydrogen as the primary source of storage. However, a similar role could also be performed by other medium-term storage technologies.
• Pumped hydro storage offers dispatchable flexibility. Our analysis assumes capacity at similar levels to the currently installed 3 GW. However, there are already plans to develop new schemes and new sites have been identified which could provide an additional 7 GW.10
• Batteries can provide within-day flexibility. The Balanced Pathway assumes 18 GW of battery storage capacity by 2035.
Use of surplus electricity
The Balanced Pathway has an important role for electrolysers to produce hydrogen at low cost from surplus generation. In the Balanced Pathway 25% of hydrogen supply comes from electrolysis in 2035, increasing to 45% by 2050.
end of page 26
Appendix 4: Alternative indicators for monitoring local energy
Section B.4 suggests that the indicator for a local target for renewable energy, and for quantifying the contribution of individual projects, should be expressed as a percentage of local demand for electricity. Two other indicators in common use, but not favoured by REAG are:
“powering homes” – the best known example is the prime minister’s statement that the UK offshore wind target for 2030 would be enough to “power every home.” Stating instead that this target would supply 32% of the UK’s total demand for electricity in 2030 better conveys the dependence on other technologies. Total demand includes non-domestic buildings, transport and industry.
These statements are often vague as to whether the “homes” are contemporary in electricity usage or whether they anticipate net-zero conditions (for which increased demand for electricity is projected).
“emissions reduction” – proposals for a solar farm or rooftop solar development are often presented as delivering an annual saving of CO2 emissions. This saving is calculated by applying the carbon intensity of the national grid to the output of the new project (which displaces fossil fuel supply in the grid). Such figures are difficult to relate to the local context.
In particular, they fail to convey that the “emissions reduction” will be diluted across the national grid rather than contribute to a local goal. Furthermore the reduction will diminish every year as the grid decarbonises. By 2035, there will be no carbon in the grid to save, if current ambition is achieved.
Winchester City Council: Carbon Neutrality Action Plan 2020-2030
The City Council’s action plan adopts the “emissions reduction” approach, described as “eliminating carbon emissions ….. through the use of renewable energy that does not produce any carbon emissions.” On pp 21/22 the Plan aligns its proposals for generating new renewable energy with the “elimination” of emissions attributable to the consumption of gas, electricity and other fuels by non-domestic users.
For a carbon neutral goal, an approach to energy that fails to address the demand of domestic users and transport, present or future, is incomplete, aggravated by reference to eliminating current emissions rather than fulfilling future demand.
To express this a different way: there are no direct emissions from electricity generation in our District to be saved. There are no power stations located in Winchester District. Our local electricity generation is 100% renewable; there just isn’t enough of it and we need to leverage progress by reference to the large gap between supply and demand.
end of page 27
Appendix 5: Energy opportunity mapping: Test Valley case study
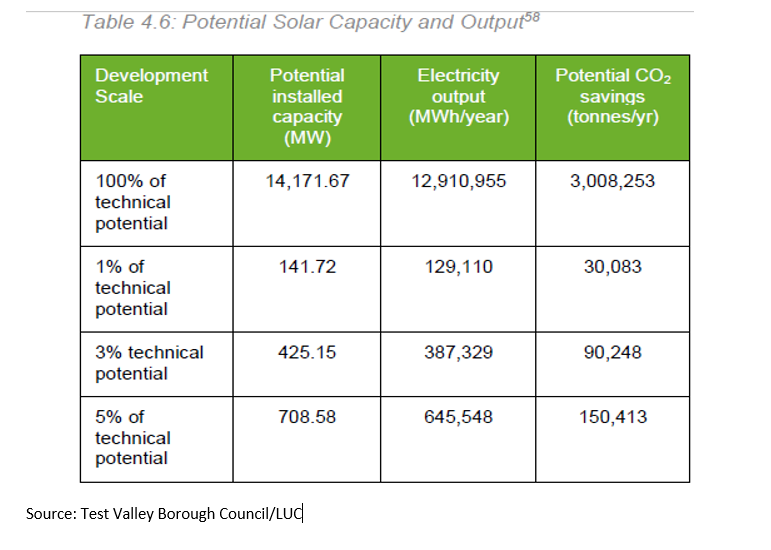
To contribute to the evidence base for the review of its Local Plan, Test Valley Borough Council commissioned a “Renewable and Low Carbon Energy Study” from LUC in association with the Centre for Sustainable Energy. The Study is referenced in B.4.
Published in December 2020, the report adopts mapping technology to estimate the potential capacity of solar and wind energy, on the basis that every possible site within Test Valley was developed, having first taken account of known constraints for the technology and for planning regulations. For example, the technical potential for ground-based solar excludes land sloping by more than 10 degrees, or that is designated (SSSI) etc.
This energy mapping exercise concludes that ground-based solar pv alone has the potential to deliver more than 30 times the current demand for electricity in the Borough.
There are further constraints that will reduce this technical potential to “deployable potential”, notably the current limitations of grid capacity, noted in Section C.3. And local opposition to solar farms, described in the report as “landscape sensitivity”, may be especially potent in the most rural areas.
The report does not attempt to quantify these further constraints but observes that just 3% of the technical potential would be sufficient to match current demand for electricity, when added to existing solar farms. The report makes no reference to future increase in demand for electricity, perhaps because the research was conducted before publication of 6CB.
end of page 28
Current demand for electricity in Test Valley is almost identical to that in Winchester District. The Borough also has similar topography and irradiance, but overlaps with the New Forest National Park to a smaller extent than the Winchester overlap with the South Downs Park.
The map below displays the Opportunities (beige) and Constraints (mauve) for solar development in Test Valley.
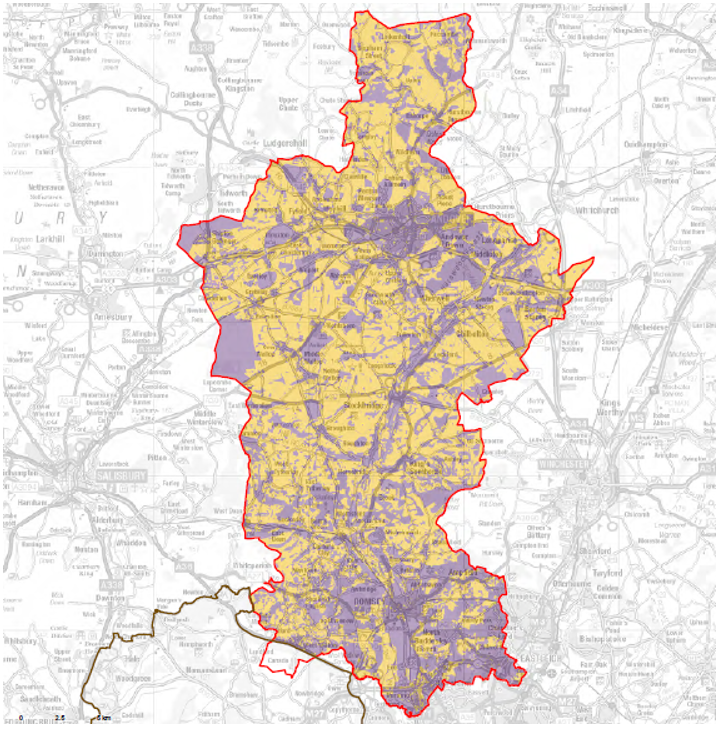
Source: Test Valley Borough Council/LUC. © Contains Ordnance Survey data Crown copyright
end of page 29
Appendix 6: Increase in wind and solar to deliver Targets
This Table extends the similar table in B.4 to illustrate combinations of solar and wind energy that would fulfil the different target options presented.
| Target | 2030 Target formula (%age of local demand, sustained to 2050) | Indicative technology split by 2050* |
| Low Ambition | 50% | 6x 2020 solar; zero wind |
| Enhanced Ambition (adding wind) | 50%-100% | 6x 2020 solar plus 10 wind turbines for each addition of 3.5% to the Target (each turbine capacity 1.5MW, hub height 65m) |
| Full Potential | 100% | 12x 2020 solar or 6x 2020 solar plus 145 wind turbines or intermediate combination |
| *60% of above combinations by 2030, increasing to the 2050 combination, in line with demand |
end of page 30
Appendix 7: Local solar platforms: solar farms or rooftop?
Summary
Past evidence suggests that the contribution of rooftop solar in our District is likely to remain a small fraction of the target, even if supported by generous subsidy.
Projections for the UK by Solar Energy UK foresee a similar dominant role for utility solar.
******
Appendix 1 records the relative contribution to local demand for electricity of each of the familiar platforms for solar pv – solar farms (13.6%), domestic rooftop (1.4%) and non-domestic rooftop (0.8%).
In tackling a formidable target, such as a sixfold increase in solar pv, are these relative contributions likely to change? Is there any prospect of new platforms such as brownfield sites or floating solar?
The past offers telling evidence for future trends. The period 2010-2019 can be perceived as a decade-long trial for subsidised solar energy. Over 2,200 homes and organisations in Winchester District took advantage of the feed-in tariff subsidy over that decade.
A sixfold increase in solar generation requires the addition of approximately 11,000 domestic and non-domestic units in a similar period. Central government subsidy is not only essential but will need to be compelling to inspire growth of this order.
A further reservation about rooftop solar is its modest scale. The medium-sized 25 MW solar farm recently approved at Christmas Hill in Headbourne Worthy parish will create almost double the capacity of the District’s entire portfolio of rooftop solar (13.3 MW) developed over the last 15 years.
A 2020 report commissioned by Test Valley Borough (Appendix 5) concluded that the total of all potential rooftop solar in that District is 61 MW (domestic) and 109 MW (non-domestic), the equivalent of three large solar farms. A 2019 report for SSEN by Regen estimated that rooftop solar for the City of Southampton would reach total capacity of 36MW by 2032, on its most optimistic assumptions.
This evidence suggests that rooftop solar pv will continue to have an important role in local decarbonisation of the grid but not to the extent of reducing dependence on solar farms.
Some existing UK solar farms have been developed on brownfield sites; in Winchester District planning permission was granted for the Funtley Landfill site (see Appendix 8). But in general brownfield sites are too small for utility solar and are earmarked for housing development. The current brownfield register for Winchester District consists entirely of small sites linked to housing plans.
end of page 31
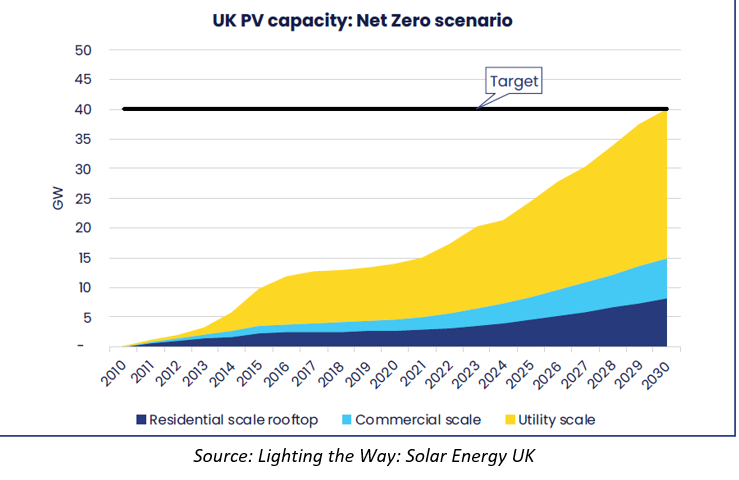
Solar Energy UK, the trade association for the solar industry, has responded to 6CB by calling for a target of 40GW of solar capacity by 2030, almost three times the 2020 figure and consistent with the 6CB roadmap for net-zero 2050.
In its report, Lighting the way: making net zero a reality with solar energy, published in June 2021, Solar Energy UK anticipates that its net-zero scenario will see both rooftop and utility-scale solar farm capacity increase by the headline multiple of about three times by 2030, creating 13,000 new jobs.
However, the report warns that this scale of increase for domestic rooftop solar is dependent on the government providing “long-term support to homeowners and renters who wish to retrofit their homes.” At the time of writing, there is no sign of mainstream subsidy for domestic rooftop solar.
Nonetheless, this report for Winchester District mirrors the Solar Energy UK assumption that future expansion of solar capacity will apply equally to our baseline position for rooftop and solar farms.
Solar Energy UK projections do not recognise a separate category for brownfield sites.
end of page 32
Appendix 8: Solar farm pipeline in Winchester District
This table lists planning applications for solar farms received since the hiatus in 2017. Highlighted details indicate that the outcome is not decided, at the time of writing:
| Date of first submission | Address | Parish | Capacity (MW) | Status |
| May 2020 | Locks Farm | Bishops Waltham | 18 | Revised plans under consideration |
| June 2020 | Dean Farm, Ropley | Bishops Sutton (overlap with East Hants) | 18 | Screening phase completed but withdrawn due to planning issues |
| Aug 2020 | Christmas Hill | Headbourne Worthy | 25 | Approved and expected to be operational in July 2022 |
| Aug 2020 | Godsfield Lane | Old Alresford | 12 | Revised plans under consideration |
| Nov 2020 | Wallers Ash Farm | South Wonston | 50 | Screening phase completed; but withdrawn due to grid connection costs |
| May 2021 | Lovedean | Denmead (overlap with East Hants) | 50 | EIA required; EIA scoping complete; planning application expected to be made in Q1 2022 |
Miscellaneous Plans
There is a site at the former Funtley Landfill, Titchfield Lane for which a 10MW solar farm was approved in 2013 but not constructed at that time. A recent application to enable construction to proceed is currently pending.
There is a small 3MW site at Moorshill Farm, Fontley Road, Titchfield for which planning permission was granted in 2017, but construction is not complete.
An application by Portsmouth Water to develop 1.5MW of solar pv at the Worlds End Pumping Station in Hambledon parish has been approved as a “permitted development” (ie. not requiring full planning permission).
In early 2021 Winchester City Council issued a tender for a feasibility study for 30 acres of land known as the Littleton Triangle to understand its suitability for the creation of a solar farm.
end of page 33