This report was first published by Winchester Action on the Climate Crisis (WinACC)
*******
written by Bill Gunyon for the WinACC Renewable Energy Action Group
May 2023
The underlying purpose of WinACC’s 2022 report on Renewable Energy in Winchester District was to establish a 2020 baseline of relevant local data and its growth trend. This stimulated the challenging questions raised in that report, whilst filling a gap in Winchester City Council’s Carbon Neutrality Action Plan 2020-2030 and its subsequent reviews.
Our 2023 report aims to update data on installations generating electricity from renewable sources in our District, hopefully setting a trend for regular annual reviews by WinACC.
end of page 1
Introduction
Events of 2022 could hardly have done more to provoke greater ambition within UK households and businesses to reduce their dependence on the national electricity grid. Soaring costs have ramped up awareness that local solar and wind resources can satisfy our growing demand for affordable electricity.
The UK energy crisis has also boosted public support for large scale renewable projects, evidenced through a new question about energy infrastructure included in the government’s Public Attitudes Tracker during 2022. The survey found that 81% of respondents said they would be very happy, fairly happy, or would not mind, if a solar farm was constructed in their local area.
Expansion of solar energy at the rates envisaged in the 2022 British Energy Security Strategy, and in the 2023 analysis by the UK Climate Change Committee, compels every rural district to play its part. WinACC has urged the Winchester City Council to commit to a rapid scaling up of the modest progress recorded in this document.
This report should be of interest to all those encouraging and implementing renewable generation of electricity in Winchester District, crucial to decarbonisation of the electricity grid and our vision of a net-zero District.
*****
Contents
1. What recent progress can we report?
2. How do we compare with our neighbours?
3. Are we closer to our renewable energy target?
4. Let’s not forget electricity consumption
Appendix 1: Reporting renewable energy data
Appendix 2: Renewable energy data for Winchester District
Appendix 3: Vision 2035: District renewables
“renewable energy” is expressed in this report only in the context of generating electricity. References to “energy” (eg.energy plans, energy projects etc) relate to renewable energy. As solar and wind dominate UK renewable energy plans for the coming decade, other clean technologies are not addressed in this report.
end of page 2
Report Summary
- The growth rate of rooftop solar installed by homes in Winchester District from 2019 to 2022 was one of the highest in the country.
- Despite this impressive growth, the total output of local rooftop solar represents less than 3% of consumption of electricity in the District.
- Decarbonisation of the national grid by 2035 will need to include significant expansion of solar farms in rural districts, together with the reintroduction of onshore wind.
- A strategic plan to match local supply of electricity with local demand requires the City Council to embed this target into its Carbon Neutrality Action Plan and the Local Plan review.
- Government data for local solar installations is evolving and liable to adjustments. This data is not yet disaggregated between domestic and non-domestic assets. Publication of disaggregated energy generation data of relevance to parish communities is keenly awaited.
******
1.What recent progress can we report?
Solar photovoltaic (pv) continues to be the dominant technology for renewable energy in Winchester District. At the end of 2022 any installations of wind, hydro and biomass remained too small to register in District-wide data for electricity generation.
A new database for small scale installations
Thanks to the new MCS Data Dashboard launched in November 2022, we can monitor trends in small scale local solar pv installations, not only by number, but also by cost. And the data has been backdated to 2019.
As the organisation responsible for standards of UK renewable energy contractors, their products and their installations, MCS holds data for almost every certified installation.
end of page 3
MCS Data Dashboard: solar pv installed in Winchester District 2019-2022
| New installations | Average cost (£) | Average cost per kilowatt (£) | Average kilowatt capacity | Total new kilowatt capacity | |
| 2019 | 321 | 4,512 | 1,533 | 2.9 | 945 |
| 2020 | 302 | 4,804 | 1,563 | 3.1 | 928 |
| 2021 | 574 | 6,910 | 1,860 | 3.7 | 2,132 |
| 2022 | 756 | 7,537 | 1,748 | 4.3 | 3,260 |
| 4-year totals | 1,953 | 7,265 |
- The “capacity” of an installation is the energy generated when operating at maximum output. One “kilowatt” is the amount of energy required for a domestic appliance such as an iron or fan heater.
- A 4 kilowatt home system requires 10 solar panels, depending on specification.
- MCS data excludes installations larger than 50kW and therefore represents almost entirely rooftop systems. The only known rooftop installations larger than 50kW implemented in this period are at Marwell Zoo and Biffa Waste (Winchester).
- No large ground-based installations (solar farms) became operational in this period.
- The final two columns have been derived from the first three columns which draw data directly from the database.
- MCS data may exclude installations for new housing estates and may also omit some unregistered small-scale installations. No information about battery storage is included. Please see Appendix 1 for further comment about the MCS Data Dashboard and reporting local solar pv data.
———
More than trebling annual additions of rooftop solar capacity in the District over a four-year period is encouraging, notwithstanding the difficulty of assessing the disruption of the pandemic and the Ukraine war.
This is a new database which we hope in future will refine its distinction between domestic homes and all other buildings. These are two fundamentally different markets for promotion and financing of solar systems.
2.How do we compare with our neighbours?
MCS reports that 3.7% of households in Winchester District added a solar pv installation over the four-year period to 2022, placing it in the top ten local authorities in England.
Perhaps reflecting the potential of solar in southern England, Eastleigh and East Hampshire districts also feature in this top ten. Here’s the full picture for neighbouring districts:
MCS Data Dashboard: Percentage of households installing solar pv
| 2019-2022 | 2009-2022 | ||
| Eastleigh* | 4.9% | Eastleigh* | 11.1% |
| Winchester* | 3.7% | East Hampshire | 9.8% |
| East Hampshire* | 2.7% | Winchester | 8.8% |
| Test Valley | 1.3% | Test Valley | 5.5% |
| Basingstoke & Deane | 1.2% | Basingstoke & Deane | 4.2% |
end of page 4
3. Are we closer to our renewable energy target?
Every additional local installation generating electricity from renewable sources should be applauded. Unfortunately, recent years of strong growth in local rooftop solar have had minimal impact upon a key measure of progress in the District.
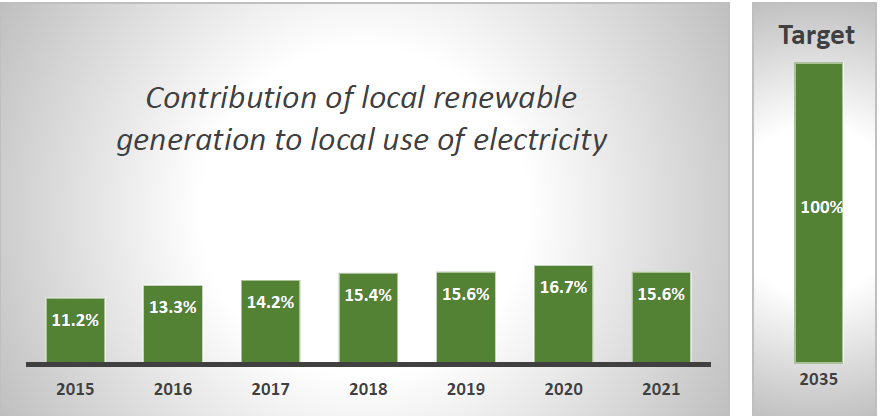
Contribution of local renewable generation to local use of electricity
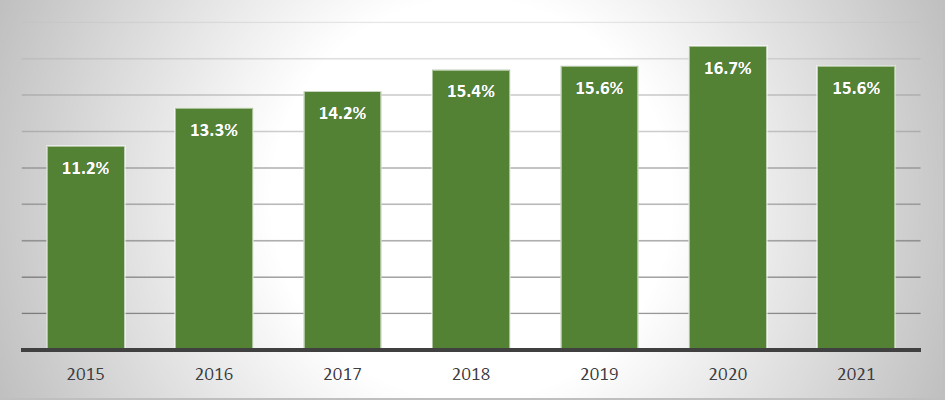
- 2021 is the latest year for which the relevant data is available – see Appendix 2 for detail and sources
- During this period, only two very small solar farms became operational (in 2017)
The fall in 2021 can be attributed largely to the “performance” of the sun in our region (hours of sunshine) which dropped about 10% from the previous year. This variation is not unusual and will probably be reversed by the hot summer of 2022. A reduction in business consumption of electricity in the 2020 lockdown also exaggerates the correction in 2021.
These variations cannot hide the underlying reality that growth in local renewable energy is static, at a time when it should be surging ahead. A target to match local generation to 100% of local consumption in Winchester District by 2035, the government’s deadline for decarbonisation of the electricity grid, remains a long way off.
Rooftop solar can deliver significant value to a household or business and market forces should propel further impressive growth. However, this application of the technology will fail to boost the aggregate position across the District, unless scaled up dramatically. For this to happen, prospective investment returns for every owner of property with a suitable roof profile must become compelling and accessible.
The peak years of the discontinued Feed-in Tariff, 2011-2016, are a reminder that such an incentive scenario is possible. But the current UK government shows no inclination to revive mainstream support for rooftop solar, preferring to subsidise oil and gas exploration.
end of page 5
Data relating to solar farms emphasises the limitations of rooftop solar. The solar farm at Three Maids Hill, near Winchester, that became operational in February 2023 will supply more electricity, in any given period, than all the rooftop solar installed in Winchester District in more than two decades since the technology came to market. If this solar farm had been operational in 2021, the percentage in the above chart would have increased to 20%, as shown below:
Illustrative impact of one new solar farm on 2021 supply profile
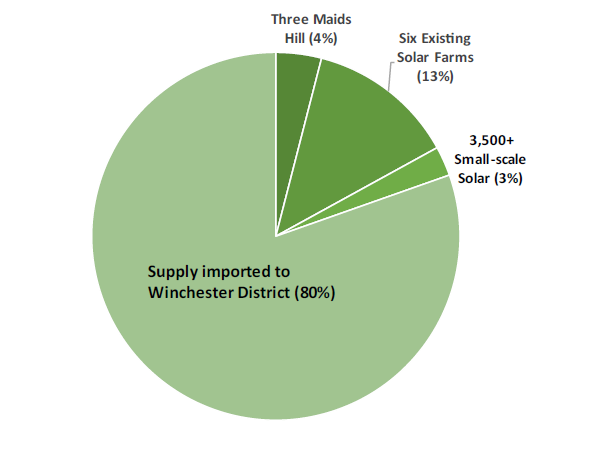
To achieve a District target of filling this pie chart with local renewable generation by 2035, we have no option but to plan for a significant number of solar farm projects, alongside exploitation of new opportunities for local wind turbines.
4. Let’s not forget electricity consumption
It’s a mistake to blame poor progress solely on sluggish delivery of renewable generation. Consumption of electricity is the other side of the coin for matching local supply to local demand.
In its modelling for UK net zero 2050, the UK Climate Change Committee predicts that electricity consumption will fall slightly in the period 2018-2024, as appliances become more efficient, before the new demand from electrified heating and transport imposes a growth trend. Will this preliminary fall in consumption be achieved in Winchester District?
end of page 6
Electricity consumption in Winchester District (GWh per annum)
| Domestic | Non-domestic | Total | |
| 2018 | 226.4 | 371.8 | 598.1 |
| 2019 | 226.4 | 360.0 | 586.4 |
| 2020 | 244.1 | 313.4 | 557.5 |
| 2021 | 235.9 | 326.6 | 562.5 |
Total consumption has fallen by 6% over this period, but only on account of the drop in non-domestic demand. There is limited scope for drawing conclusions, given the distortions created by the covid pandemic and, more recently, the European energy crisis. Future local consumption data must be monitored, at parish scale as well as District.
WinACC’s own projections (Appendix 3) currently assume that demand for electricity will increase 50% by 2035 from a 2020 baseline. This mirrors the national assumption adopted by the Climate Change Committee. Clearly, a more refined projection that reflects the local profile of consumption would be valuable for monitoring purposes.
******
Conclusion
Rooftop installations deploy on average 8-10 solar panels for a domestic property, and perhaps 100 panels for a reasonably ambitious business project.
A ground-based solar farm operates tens of thousands of panels, even at the lower end of the viable range. Economy of scale is decisive. This report reveals rooftop costs of around £1,750 per kilowatt. Market conditions are volatile but a solar farm development can aspire to build capacity for a third of that price.
Improvements in solar pv data are telling us what should already be obvious. For electricity generation, the rapid results that climate science compels over the next ten years must be delivered in part by the solar farm model.
Rooftop solar has a vital role to play for homes and employers, especially in dampening the shocks of external energy pricing. But policymakers and campaigners should pause before devoting limited resources to bolster small scale investments. Big energy investors need no financial subsidy but much more can be done to build relationships and tackle the constraints they face.
end of page 7
Appendix 1: Reporting renewable energy data
WinACC is aware of only one other annual progress report focused on local renewable energy data. The South Gloucestershire Renewable Energy Progress Report 2019-20 offers an in-depth assessment prepared by energy consultants, Regen. Baseline data for local renewables is also presented in reports by AECOM for North Somerset and Northwest Leicestershire authorities.
The recent work of Climate Emergency UK verifies that renewable energy is too often glossed over in local authority climate plans and, by extension, their progress reports. Too many make the assumption that the national electricity grid will decarbonise and expand its capacity without targeted local contributions. The Carbon Neutrality Action Plan of Winchester City Council is no exception.
This is the wrong starting place for the national imperative to scale up solar and wind technologies, in anticipation of net-zero solutions for heating, transport and industry.
Renewable energy data developments in 2022
As reported in the main text, the launch of the real-time MCS Data Dashboard in November 2022 potentially transforms the ability to monitor progress within a district. The database is updated every 24 hours.
In March 2022 the Department for Business, Energy & Industrial Strategy (now Department for Energy Security and Net Zero) published a Review of solar PV capacity publications, detailing its methodology for producing solar pv deployment statistics. The Department works with Sheffield Solar (a research group at The University of Sheffield) and Solar Energy UK, the trade association.
In preparing this report, WinACC has raised queries with all of these data-providers and now offers the following broad observations about solar data:
- there is a history of difficulty in compiling accurate data, especially since the termination of the Feed-in Tariff scheme in 2019.
- determined efforts to improve solar data quality are under way but are incomplete; annual figures may reflect one-off adjustments. This is the case for Renewable electricity by local authority, the key source for Appendix 2, published by the government in September 2022.
- there are teething problems with the MCS Data Dashboard.
- The data-providers have hinted at prospects for disaggregation of solar data to postcode scale, so that electricity generation within parish boundaries could be derived. This will be welcomed by WinACC. We believe that the renewables challenge can be met only if local communities are empowered to play a strategic role in finding suitable sites for projects and motivating local homes and businesses.
end of page 8
Appendix 2: Renewable energy data for Winchester District
Contribution of local renewables to District demand at end of 2021
There were 55,447 domestic meters and 6,116 non-domestic meters in Winchester District at the end of 2021.
Sources (DESNZ, formerly BEIS):
Regional Renewable Statistics (September 2022).
Local Authority Electricity Consumption Statistics (December 2022)
Solar Farms in Winchester District (below)
There are 192 installations of solar thermal technology registered for Winchester District in the MCS database, mostly dating from 2011-2016.
There are no known operational community energy installations in Winchester District.
******
*Annual solar generation is determined by the impact of the sun’s radiation (insolation) over the period. This is reported as a percentage called the “load factor” which quantifies electricity generated in relation to installed capacity. The 2021 load factor for solar in the South East region was 10.3%, unusually low and a significant reduction from 11.4% recorded for the previous year.
The division of total generation between solar farms and smaller scale installations in the table above has been determined by applying the load factor (above) to the installed capacity for both. Generation data for individual solar farms is not currently available, nor for large rooftop systems.
** see Section 4 for recent history of District demand for electricity.
*** Generation of the wind, hydro and biomass installations is too small to be included in government data and is insignificant in relation to total solar generation.
end of page 9
Operational solar farms in Winchester District at end of 2021
| Address | Parish | Operator | Operational | Installed Capacity* (MW) |
| Raglington Farm, Botley Road, | Shedfield | Next Energy Solar Fund | 2013 | 5.8 |
| Whitehill Lane, Alresford | Bishops Sutton | Octopus Investments | 2014 | 12.0 |
| Southwick Estate, Belney Lane | Southwick | Bluefield Solar Income Fund | 2015 | 48.0 |
| Field House Farm, Hursley | Hursley | Foresight | 2015 | 6.4 |
| Winchester Road, Bishops Waltham | Bishop’s Waltham | Solafields | 2017 | 6.0** |
| Forest Farm, Winchester Road, Waltham Chase | Bishop’s Waltham | Next Energy Solar Fund | 2017 | 3.0 |
| Total | 81.2 | |||
*operational capacity may be restricted by the terms of the grid connection agreement
**approved capacity was 12MW but the site was not constructed in full. This figure is an estimate.
Source: DESNZ Renewable Energy Planning Database: January 2023
At the time it became operational in 2015, the Southwick Estate solar farm claimed to be the largest in the UK.
For comparison with neighbouring rural districts, installed capacity of solar farms in Test Valley is more than double that of our District, whereas East Hampshire and Basingstoke and Deane are both about half.
In February 2023 the new 25MW solar farm operated by Enviromena at Three Maids Hill in Headbourne Worthy parish came on stream.
Solar farm pipeline in Winchester District
Planning permission for an 18MW solar farm for Next Energy at Locks Farm, Bishop’s Waltham was granted in March 2023.
A 50MW application by Enso at Denmead Farm appears to be close to a final decision. The site is shared with East Hampshire district.
A site at the former Funtley Landfill, Titchfield Lane for a 10MW solar farm is also pending a final decision. It was approved in 2013 but not constructed at that time. The updated application is being considered by Hampshire County Council because disposal of waste materials is involved in the construction.
There is a small 3MW site at Moorshill Farm, Fontley Road, Titchfield for which planning permission was granted in 2017, but construction is not complete.
Portsmouth Water has planning permission for a 1.5MW ground-based solar development at the World’s End Pumping Station in Denmead parish.
There are further sites in Winchester District that have secured a connection agreement with SSEN as a first step towards a potential solar farm application.
end of page 10
Appendix 3: Vision 2035: District renewables
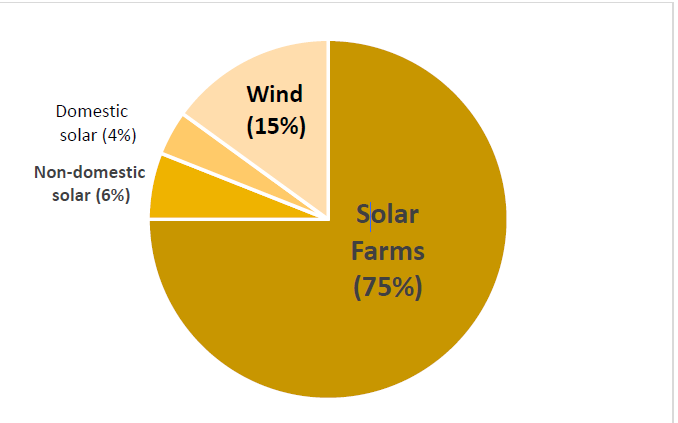
2035 is the government’s target date for decarbonisation of the electricity grid. A local target that matches the supply of renewable generation to demand for electricity would require 880 GWh of generation per annum, assuming a 50% increase in demand from 2020.
Following the example of the Climate Change Committee and National Grid, WinACC engages with relevant partners to create a vision of how the target might be delivered, as a tool for building local consensus. The pie chart above predicts the profile. The table below quantifies what this would entail, based on average load factors for solar and wind.
| Renewable Option | Presumption | Additions 2020-2035, based on average capacity |
| Solar farms | Availability of private capital without subsidy is sustained. | 24 @ 25MW (requiring 1,000 hectares; 1.5% of District land area) |
| Domestic solar | The majority of suitable home roofs will be fitted, accelerated by subsidy | 10,000 @ 3.5kW |
| Non-domestic solar | Energy cost savings will drive this sector, led by larger employers and landowners. | 550 @ 100kW |
| Wind | Revised planning regulations will revive this sector. Low cost and improved output will create models for single/twin turbine projects, perhaps in addition to wind farms. | 50 turbines @ 1.0 MW |
These presentations remain at a very early stage of work in progress but are likely to feature in future reports, with the aim of improving the model.
end of page 11